What people search for says a lot about what they’re about to drink.
Before the first sip, there’s a moment of intent: a recipe search, a last-minute plan, a seasonal craving. Search data captures that moment in real time, offering a window into how cocktail culture actually moves.
At FORM, uncovering patterns in data is part of our job, whether it’s operational workflows or retail execution at scale. So we decided to take that same approach and apply it to something more social: what Americans are drinking and when.
Search interest isn’t a perfect reflection of consumption, but over time, the signals add up, revealing clear seasonal rhythms and standout trends. Drawing on data from March 2025 through March 2026, this analysis tracks those patterns across the year, showing not just what’s popular but how preferences shift with the calendar.
Note: This post was published on April 17, 2026, and reflects data collected between May 2025 and March 2026.
Share this infographic by embedding this code:
Key Takeaways
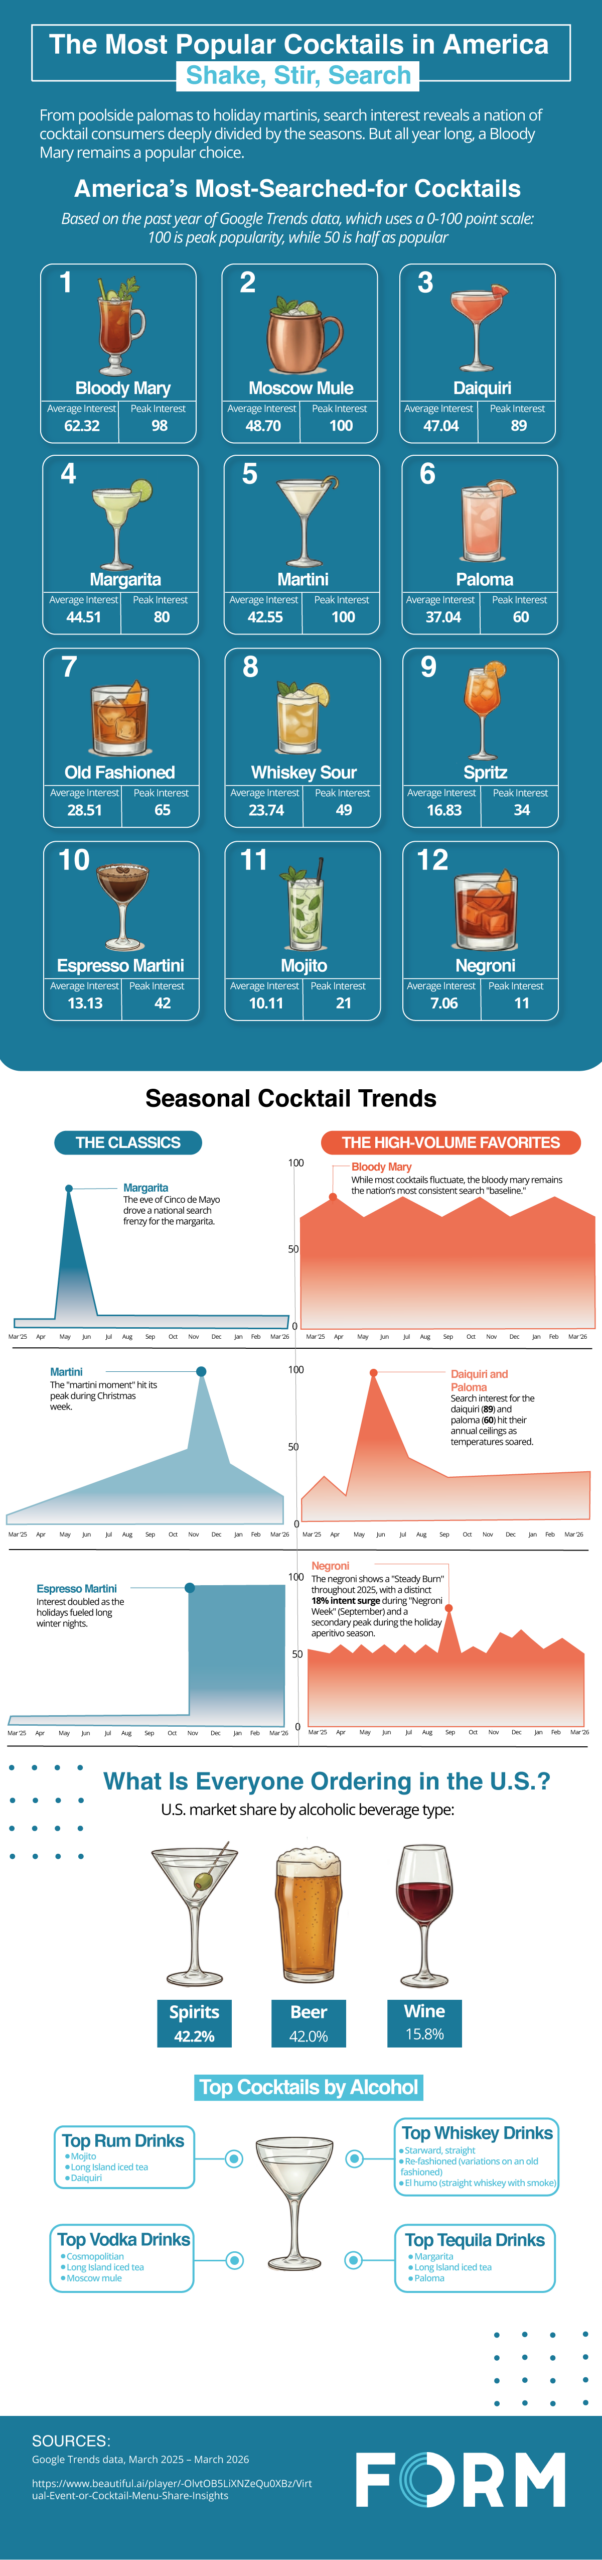
- The Bloody Mary is the only cocktail to maintain consistently high interest year-round, never dropping below 50 on a 100-point scale.
- Moscow mules and martinis both hit peak interest scores of 100, the highest possible level of search activity.
- Seasonal spikes are sharp and predictable, like the margarita’s surge just before Cinco de Mayo.
- Warm weather drives behavior: The daiquiri and paloma both peak at the height of summer.
- The espresso martini stays quiet most of the year, then surges dramatically during the December holiday season.
What Google Trends “Interest” Actually Means
The rankings in this infographic are based on the Google Trends 0–100 scale. This measures relative popularity, not total search volume. A score of 100 represents a cocktail’s single highest moment of interest during the year. A score of 50 means it was half as popular as that peak at a given time.
This makes it possible to compare two different patterns:
- Average Interest: steady, year-round curiosity
- Peak Interest: sharp, seasonal spikes
Some drinks maintain constant attention, while others are defined by brief, intense moments of interest.
There are limits to this approach. The data doesn’t tell us how many people searched, nor does it capture offline habits, like ordering a go-to drink without thinking twice. What it does measure is mindshare: how much attention a cocktail commands at any given moment.
America’s Most-Searched Cocktails
| Rank | Cocktail | Average Interest | Peak Interest |
| 1 | Bloody Mary | 62.32 | 98 |
| 2 | Moscow Mule | 48.70 | 100 |
| 3 | Daiquiri | 47.04 | 89 |
| 4 | Margarita | 44.51 | 80 |
| 5 | Martini | 42.55 | 100 |
| 6 | Paloma | 37.04 | 60 |
| 7 | Old Fashioned | 28.51 | 65 |
| 8 | Whiskey Sour | 23.74 | 49 |
| 9 | Spritz | 16.83 | 34 |
| 10 | Espresso Martini | 13.13 | 42 |
| 11 | Mojito | 10.11 | 21 |
| 12 | Negroni | 7.06 | 11 |
| 13 | Manhattan | 5.94 | 12 |
Seasonal Cocktail Trends
While some cocktails are popular all year long, others see seasonal spikes in interest. The clearest example of this is the margarita, which sees a dramatic jump in interest in early May, right before Cinco de Mayo.
The martini tells a different story. Its popularity builds gradually through fall, reaching a high point just before Christmas. It’s less of a party drink than a seasonal staple, tied to winter gatherings and holiday traditions.
Then, there’s the espresso martini, which stays relatively quiet for most of the year before surging in December. This pattern suggests a functional role: It’s part dessert and part caffeine boost, perfectly suited to long holiday nights.
Summer brings its own rhythm. As temperatures rise, refreshing cocktails take over. The daiquiri and paloma both hit their annual peaks at the end of June, reflecting a clear link between weather and drink preferences.
Through it all, one cocktail remains constant: the Bloody Mary. Its steady, elevated interest makes it the category’s anchor, a year-round staple that doesn’t rely on seasonality to stay relevant.
What’s in Your Glass?
These search trends align with a broader shift in how Americans drink.
Spirits now account for 42.2% of the U.S. beverage alcohol market. That’s slightly more than beer, at 42.0%. Wine trails at 15.8%.
As spirits gain ground, cocktail culture expands. That growth shows up in search behavior. From simple builds like the Moscow mule to more complex classics like the Negroni, interest is spreading across a wider range of drinks. Cocktails are no longer niche; they’re central to how Americans engage with alcohol.
Top Cocktail Ingredients
Zooming in further, ingredient-level trends reveal what’s driving that interest.
Bitters lead the way, appearing in 17% of drinks, followed by rum at 11% and both gin and vermouth at 8%. Together, they form the backbone of many classic and modern cocktails.
This doesn’t mean every drink contains these ingredients, but it highlights the building blocks behind the most-searched recipes. Bitters, for example, are essential to enduring classics like the old-fashioned, while rum fuels the seasonal popularity of warm-weather favorites like the daiquiri and mojito.
Turning Industry Insights Into Action
From seasonal spikes to year-round staples, cocktail trends follow recognizable patterns. These shifts point to predictable moments of demand.
When you can track those signals in real time, you can respond to them.
For brands operating across retail, hospitality, and distribution, knowing what people want is only the starting point. The real value lies in understanding where that demand shows up in the real world: on shelves, on menus, and across locations. With on-premise and off-premise insights from your beverage distribution software, you can connect market trends to on- and off-premise execution, while market share and price tracking data provide the visibility needed to stay competitive as demand shifts.
But insight alone isn’t enough. Execution is what determines whether that demand turns into revenue. If a trending product is out of stock, mispriced, or poorly placed, the opportunity disappears. That’s why leading teams prioritize out-of-stock tracking and planogram compliance: to ensure that what people want is actually available, visible, and ready to sell.
Search data captures the moment before the pour. What happens next depends on how effectively that insight is put to work. With FORM, you can turn real-time insights into real-world results.
Sources:
- Google Trends data, March 2025 to March 2026
- Cocktail Menu Share Insights