


FORM/Blog
NRF 2024 Recap: What’s in Store for Retailers This Year
What’s in Store for Retailers This Year The National Retail Federation’s Retail’s Big Show commenced two weeks ago, but it’s still fresh in our minds.
Beer/Wine/Spirits/Blog
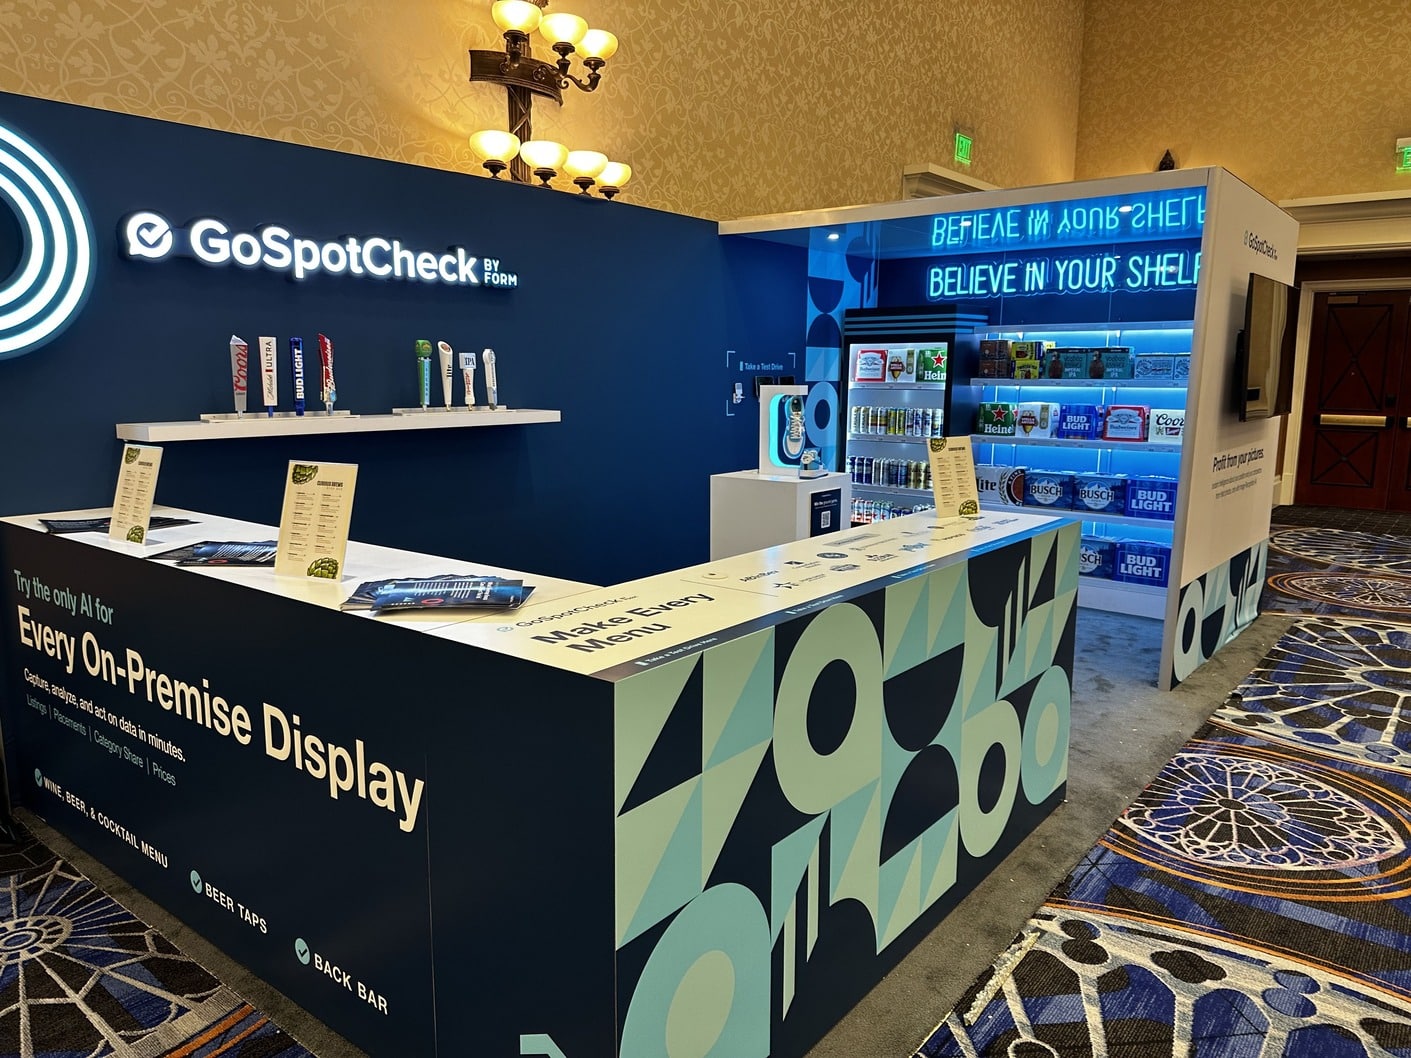
An Event Lager Than Life: Our Takeaways from the Largest Beer Show of the Year
Trends and Takeaways from the National Beer Wholesaler Association’s Annual Convention and Tradeshow Every year, The National Beer Wholesalers Association holds its annual convention and
FORM/Blog
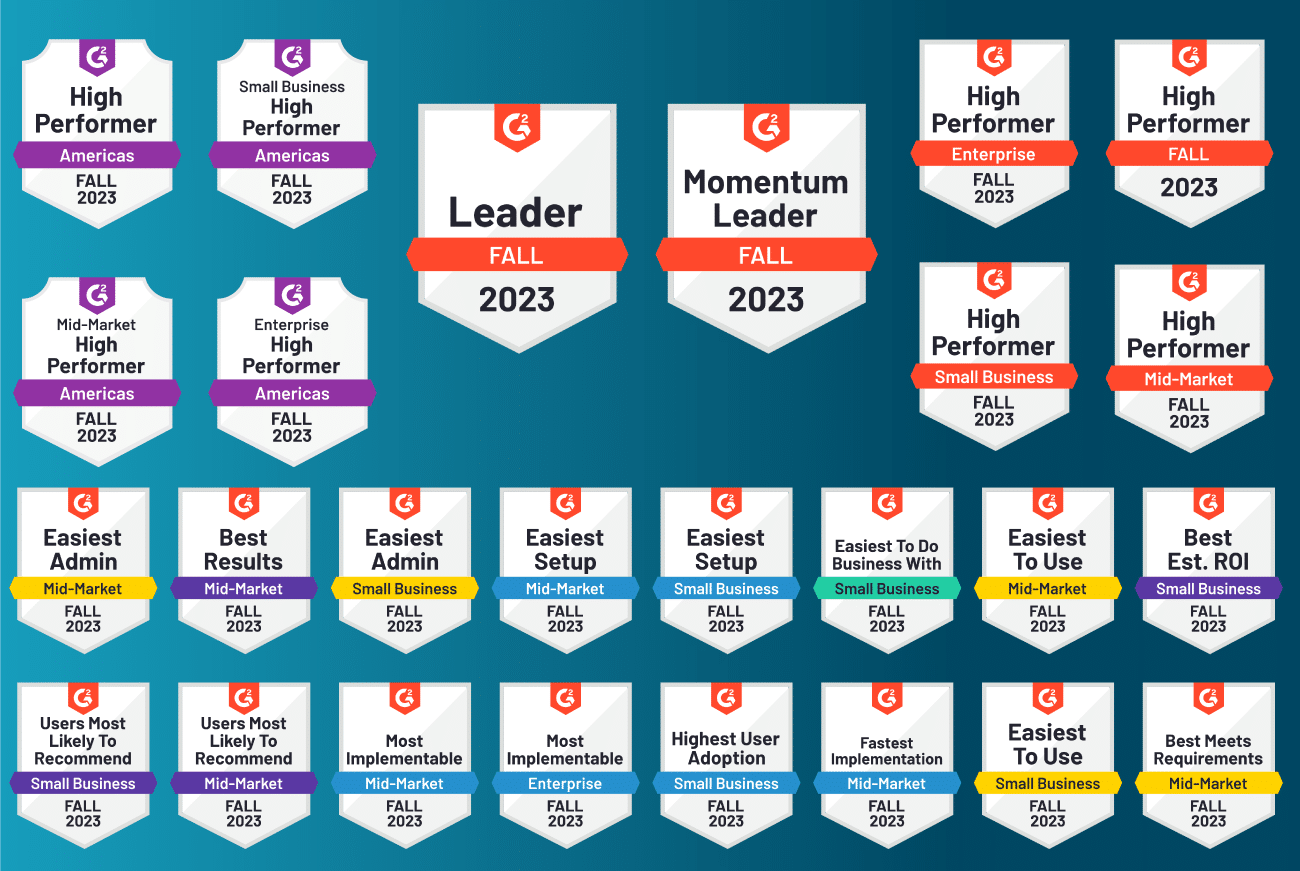
GoSpotCheck by FORM Sweeps up 26 Badges in G2’s Fall Software Report
We’re riding the wave this summer with 19 new Badges from G2! GoSpotCheck by FORM, our mobile solution for field management and retail execution, was
