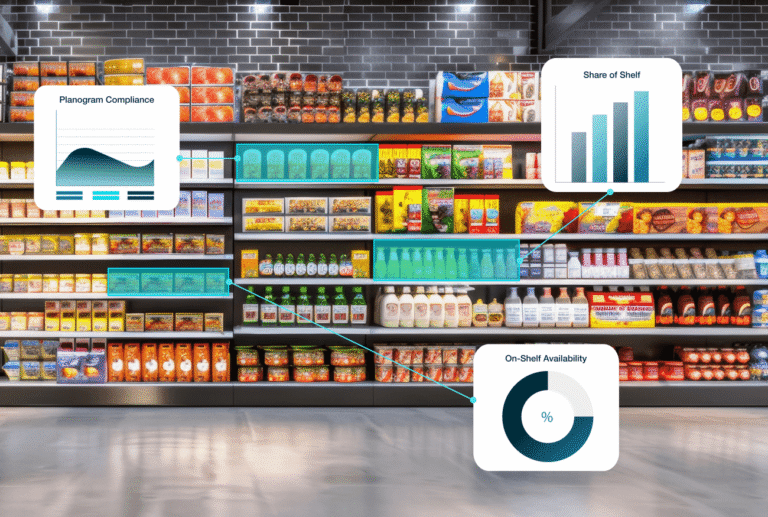



For Consumer Packaged Goods (CPG) brands, securing retail distribution is a major milestone. Brands spend months pitching category managers, negotiating slotting fees, and refining supply chains to win retail space. After all the effort, getting products placed in a major retailer store feels like the finish line.
However, that placement is only the beginning. Being “in the system” does not guarantee sales, because being authorized as a vendor only confirms the retailer purchased inventory; it doesn’t confirm your product made it out of the backroom and onto the shelves. This operational inconsistency creates a frustrating disconnect between distribution on paper and distribution in reality.
Gaining visibility into real-time distribution data, such as all commodity volume, is essential for brands looking to improve sales velocity and expand their reach. These insights provide a precise view of shelf data, helping teams align their digital data with the physical reality of the store.
Key Takeaways
- ACV (All Commodity Volume) reveals the total sales capacity of the retailers carrying your product, while TDP (Total Distribution Points) tracks the physical space your specific SKUs command on the shelf
- High ACV percentage on paper can easily mask store-level execution flaws like “ghost inventory”, products stuck in the backroom register as successfully distributed in reports but remain completely invisible to actual buyers
- Supplementing backward-looking data with modern tools like Image Recognition AI allows reps to instantly spot shelf voids and fix out-of-stocks in real time
- Protect retail investments by auditing highest-volume stores, negotiating for more shelf depth, and investigating gaps between maximum and average ACV
Defining and Calculating ACV and TDP
To make smart decisions regarding trade spend and field strategy, brands need to understand the math that drives retail execution.
What is ACV (All Commodity Volume)
All Commodity Volume (ACV) measures the aggregate retail revenue a storefront generates across every product category. Rather than tracking physical footprint alone, this metric evaluates the true commercial scale and total sales capacity of a location. Analyzing your brand’s percentage of ACV reveals whether your distribution is focused within high-performing channels that drive the highest sales velocity.
Here is a breakdown of the two primary ways to measure distribution:
| Distribution Type | Calculation Formula | What It Tells You |
|---|---|---|
| Unweighted Distribution | (Number of stores selling your product) / (Total number of stores in the market) | The percentage of physical doors carrying your product, regardless of store size. |
| Weighted Distribution (% ACV) | (Total ACV of stores selling your product) / (Total ACV of all stores in the market) | The share of total market sales volume that your retail partners represent. |
Example: Calculating ACV in a 3-Store Market
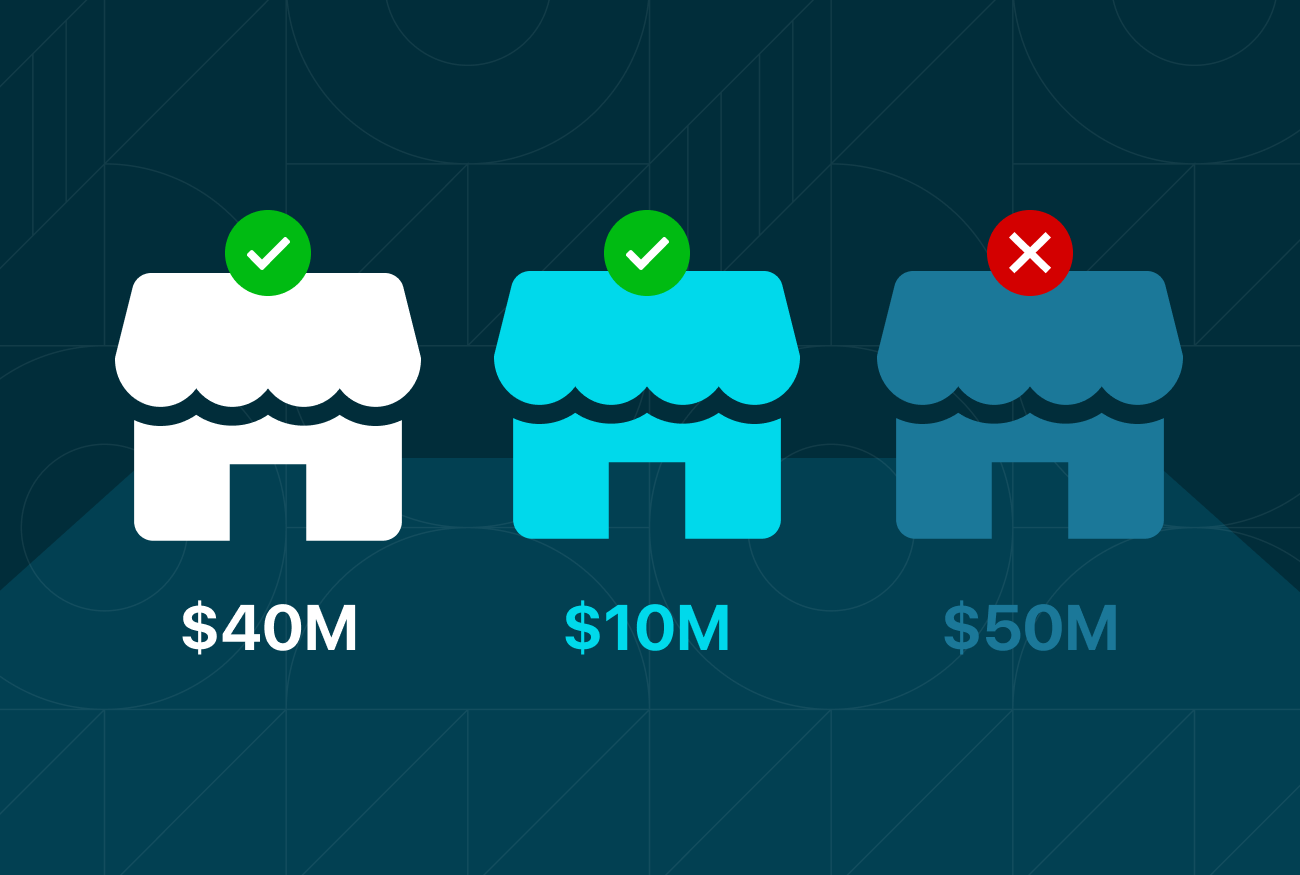
Consider a simplified market with exactly three stores, totaling an ACV of $100 Million:
- Store 1: $40M ACV (Your product is sold here)
- Store 2: $10M ACV (Your product is sold here)
- Store 3: $50M ACV (Your product is NOT sold here)
Breaking down the math:
- Unweighted Distribution: Your products are in two out of the three available stores in this market. This is an unweighted distribution of 67%.
- Weighted Distribution: Take the ACV in both stores where your product is sold ($50M) and divide it by the total market value ($100M). This is a weighted distribution of 50%.
What this means: Though your product is in the majority of the locations within this 3 store market, you’re missing presence in the biggest store in the market.
What is TDP (Total Distribution Points)
While ACV measures the breadth of your distribution, Total Distribution Points (TDP) measures the depth. Total Distribution Points calculate how many specific SKUs are actually on the shelves in those stores.
| Metric | Primary Focus | Practical Application |
|---|---|---|
| ACV | Breadth of distribution | Getting your brand into the highest-volume retailers. |
| TDP | Depth of distribution | Securing multiple facings and expanding your SKU variety on the shelf. |
For example, a beverage brand might gain placement for its best-selling drink in a top-tier grocery store. While this boosts market visibility, that individual item only takes up a few inches of shelf space.
To truly maximize Total Distribution Points (TDP) in CPG, a brand must successfully pitch and place its entire product line within those high-volume retail locations to increase overall share-of-shelf.
Why High ACV in Syndicated Data Can Be Deceptive
Weekly syndicated data might indicate a brand is authorized across every major regional retailer, but if sales velocity stays stagnant, those numbers are misleading. High ACV on paper signifies potential, yet it doesn’t guarantee shelf performance.
The gap between authorization and sales is often caused by “ghost inventory”, where products are technically in the retailer’s system but remain unavailable to shoppers. Whether stuck in a backroom, left on a receiving pallet, or obscured on a bottom shelf, these items are functionally out-of-stock. While reports from Nielsen or SPINS may register these products as distributed, they offer zero value if the consumer can’t find them. Without visibility into the physical shelf, brands risk mistaking distribution on paper for distribution in reality.
Bridging the Gap with Shelf Intelligence
Syndicated data informs what the retailer purchased, not what the shopper sees. To turn that potential into actual revenue, brands need truth from the field.
Replacing slow, manual store audits with Image Recognition AI is a fast and reliable way to eliminate ghost inventory. Field reps can snap a single photo of the shelf to instantly identify SKU-level voids that syndicated data completely misses.
Modern field sales management apps process these images in seconds and instantly trigger workflows. If an item is missing, the app prompts the rep to walk to the backroom, pull the inventory, and stock the shelf immediately. When your field agents spend less time manually counting facings and checking boxes, they spend more time actually selling, negotiating displays, and maximizing ROI on trade spend.
3 Ways to Protect and Maximize ACV
Once field teams have the right tools to capture shelf reality, leadership can deploy highly targeted routing strategies. Protect retail investments by prioritizing these three established strategies.
Strategy 1: Audit Your Highest-ACV Stores First
- Scenario: You have a limited number of field reps and cannot realistically visit every single store in your network.
- Action: Send reps equipped with compliance and execution software directly to your highest-volume retailers first. Protect your biggest investments by ensuring the planogram is actually executed where it matters most.
Strategy 2: Maximize Your TDP
- Scenario: You successfully maximize your % ACV in key stores, but your revenue growth begins to plateau.
- Action: Shift your focus from ACV breadth to TDP depth. Instruct your reps to negotiate for line extensions, pitch new seasonal flavors, or secure double-facings of your hero products to command more physical space on the shelf.
Strategy 3: Track the Discrepancy Between Max and Average ACV
- Scenario: Your Maximum ACV hits 65% during a major promotion, but your Average ACV over the quarter hovers around 51%.
- Action: Treat this wide gap as a clear red flag for chronic out-of-stocks or failed promotional execution. Route field reps to investigate and fix the high-ACV stores where your products keep falling off the shelf after the initial push.
What CPGs Need to Know About ACV
ACV and TDP tell a CPG brand where its product should be and how much it could potentially sell. However, closed-loop in-store execution is what ensures you actually capture that revenue.
With FORM’s AI-powered Image Recognition and closed-loop task management, your field reps can instantly detect voids, pull from the backroom, and correct the shelf in real-time. Don’t just measure your distribution potential—capture it. Discover how FORM helps CPG brands maximize their ACV today.
Frequently Asked Questions
What is considered a “good” ACV in CPG?
There is no single benchmark for a “good” ACV, as it depends heavily on your brand’s maturity, category, and retail strategy. For a major national brand, an ACV of 70% or higher is often expected. However, for an emerging or regional CPG brand, a 30% ACV concentrated in highly relevant, premium retailers might be incredibly successful. The goal is steady, sustainable growth rather than simply chasing a 100% metric.
What is the difference between ACV and PCV?
While ACV (All Commodity Volume) measures the total sales of a store across all departments, PCV (Product Category Volume) measures the total sales of a specific category within that store. For example, if you sell premium dog food, a grocery store might have a massive ACV selling millions in overall groceries but a low PCV for pet care if most locals buy their pet food at a specialty store nearby.
How often is syndicated ACV data updated?
Syndicated data from providers like SPINS, Nielsen, or IRI is typically updated on a weekly or 4-week reporting cycle. Because this data inherently looks backward, it creates a lag in visibility. This is why top-performing CPG brands supplement syndicated data with real-time field execution software to identify out-of-stocks and planogram compliance issues as they happen, rather than weeks later.
Can you have a 100% ACV and still have low sales?
Yes, and this is a common issue known as the “Backroom Dilemma.” A 100% ACV simply means your product is authorized and shipped to all the top stores in a market. If the product is sitting on a pallet in the receiving bay, buried on a bottom shelf, or chronically out-of-stock, your sales velocity will remain flat regardless of your perfect ACV score.