

In the Consumer Packaged Goods (CPG) industry, there is certainly no shortage of data. Brands are swimming in a sea of dashboards, spreadsheets, and performance metrics. However, trying to track everything often means you are focusing on nothing. Honing in on the right KPIs is the key to maximizing your ROI and minimizing sunk costs.
Historically, brands relied on traditional financial metrics like top-line revenue, gross margin, and syndicated scanner data. While these numbers are valuable for high-level executive reporting, they often don’t tell the full story. By the time a brand sees a dip in sales volume, the shopper has already chosen a competitor, and the revenue is already lost. These traditional data points do not provide the real-time insights required to make agile, impactful decisions on the retail floor.
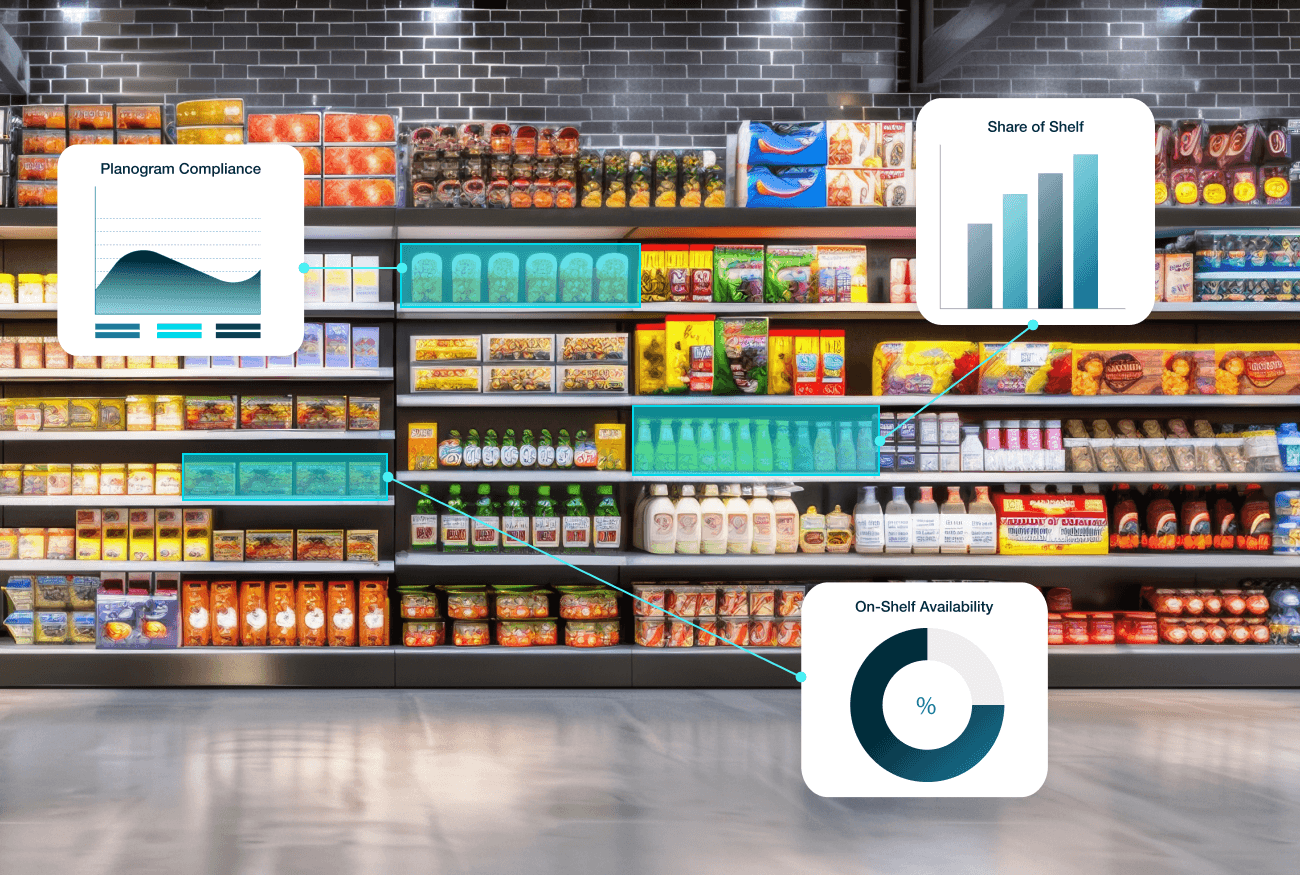
To protect your bottom line and boost profitability, it is critical to look beyond standard sales metrics and monitor real-time shelf execution. Tracking leading indicators such as On-Shelf Availability (OSA), Share of Shelf, promotional compliance, void detection, and pricing compliance helps you identify and resolve retail issues before they negatively impact your financial performance.
Key Takeaways
- Leading indicators serve as a predictive early warning system, offering real-time visibility that allows brands to address operational shortfalls and adjust strategies before financial losses occur
- Protecting revenue and accurately assessing store-level performance requires diligent monitoring of five core metrics: On-Shelf Availability (OSA), Share of Shelf, Promotional Compliance, Void Detection, and Pricing Compliance
- Expensive trade marketing investments are frequently wasted when retail execution falters, such as when discounts are not applied or promotional displays remain unbuilt in the backroom
- Product voids and out-of-stocks severely damage brand loyalty, as today’s consumers prioritize instant gratification and will quickly turn to competitors if a preferred SKU is missing from the shelf
- Brands should equip field teams with AI-powered image recognition and mobile platforms to automate shelf metric calculations and enable instant corrective actions.
The Difference Between Lagging and Leading CPG KPIs
Understanding the difference between lagging and leading CPG KPIs is a critical revenue protection strategy. When a brand does not distinguish between the two, it risks managing its business reactively rather than proactively.
Lagging indicators tell you how much money you made, but leading indicators act as your early warning system. By recognizing predictive metrics, your team can pivot trade strategies, fix operational gaps, and protect your margins before a bad week on the retail floor turns into a disastrous quarter on the P&L.
Here is a breakdown of how these two distinct categories of metrics function, who should own them, and how they drive different operational actions:
| KPI Category | Common Examples | Who Should Monitor This | Why it Matters |
|---|---|---|---|
| Traditional (Lagging) Indicators | Top-line Revenue, Gross Margin, Customer Acquisition Cost (CAC), Inventory Turnover, Syndicated Scanner Data | C-Suite Executives, VPs of Sales, Finance Teams, and Board Members | To assess the overall financial health of the business, report to investors, and validate whether long-term strategic goals were met. |
| Leading Indicators | On-Shelf Availability (OSA), Share of Shelf, Promotional Compliance, Void Detection, Pricing Compliance | Retail Operations Managers, Merchandising Directors, Field Reps, and Trade Marketing Leaders | To identify execution errors in real-time, prove trade spend ROI, and ensure the product is actually available and appealing to the shopper. |
KPI #1: On-Shelf Availability (OSA)
What it is: On-Shelf Availability (OSA) is a crucial metric that measures whether your product is physically present on the retail shelf and available for purchase at a specific point in time. It is vital to distinguish this from simply being “in stock.” Having 500 units sitting on a pallet in the retailer’s backroom means absolutely nothing if the shopper cannot physically put your item into their cart.
Why you need to track it: Empty shelves are the fastest way to kill brand loyalty. Our fast-paced, instant-gratification culture rewards brands capable of enabling immediate purchases. Modern consumers expect what they want, exactly when they want it, and they will rarely hunt down a store associate to check the backroom inventory.
Since so many CPG buying decisions happen spontaneously, a brand that isn’t physically present on the shelf misses their chance to connect with consumers.
When this opportunity passes, brand authority takes a hit. Customers are likely to either overlook your product completely or effortlessly switch to a competitor’s latest offering.
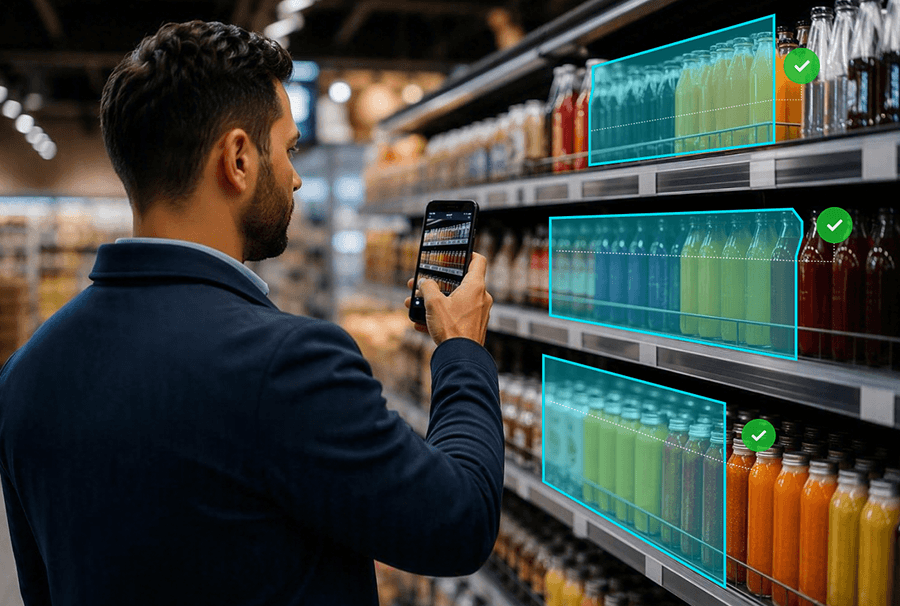
How to optimize it: Equipping field reps with modern mobile retail execution platforms can flag out-of-stocks in real time. The instant visibility allows reps to collaborate with store managers to trigger immediate shelf replenishments, fixing the problem on the spot rather than waiting weeks for lagging scanner data to reveal the financial damage.
KPI #2: Share of Shelf
What it is: Share of Shelf (SOS) represents the percentage of visual retail space your brand’s products occupy compared to the total space available in that category alongside direct competitors. Whether measured by linear shelf space or the exact number of product facings, it is a critical metric that dictates how easily a shopper can find your brand.
Why you need to track it: Shelf space is finite, expensive, and heavily contested. But, securing premium shelf placement is critical to a product’s success. Earning that space involves an exhaustive negotiation process, especially for up-and-coming brands fighting for real estate against legacy giants.
To negotiate share of shelf, brands must present data proving their product’s performance. Retailers heavily evaluate sell-through rates and the product’s contribution to their own profit margins. VPs of Trade Marketing often resort to massive amounts of trade spend to lock in these shelf agreements. However, if your brand is paying for 30% of the category space but only receiving 15% execution at the local store level, your trade spend is bleeding out without any return.
How to optimize it: Historically, tracking Share of Shelf data relied on processes that are manual, slow, subjective, and prone to human error. However, modern AI and Image Recognition tools automatically calculate Share of Shelf against competitors. Using image recognition trends, you can maximize trade spend ROI and hold retailers accountable for Share of Shelf.
KPI #3: Promotional Compliance
What it is: Promotional Compliance measures whether retail partners are accurately executing your negotiated displays, end-caps, point-of-purchase (POP) materials, and secondary placements exactly as agreed upon—meaning on time, fully stocked, and in the correct store location.
Why you need to track it: Brands invest millions into promotional strategies designed to trigger massive volume spikes, encourage trial of new products, and capture seasonal foot traffic. Well-executed promotions dramatically enhance brand awareness and improve the overall shopper experience, often creating a halo effect that boosts the sales of your non-promoted SKUs in the main aisle.
However, if an expensive, highly anticipated display is left sitting in a dark backroom during a crucial shopping weekend, that entire budget is wasted, and the projected revenue vanishes. Tracking promotional compliance is the only way to ensure your marketing investments are actually reaching the consumer.
Despite signed agreements at the corporate level, store-level execution can fall apart due to these common factors:
- Communication Breakdowns: There is a disconnect between corporate retail headquarters (who agreed to the promotion) and the local store associates (who actually have to build it).
- Complex Builds: If a corrugated display is too difficult or time-consuming to assemble, store associates are highly likely to abandon it in the warehouse.
- Competing Priorities: Your brand is not the only one fighting for floor space. Store managers may prioritize a competitor’s display simply because it arrived first or was easier to set up.
How to optimize it: To guarantee execution, brands should digitize their field processes. Instead of relying on store managers’ word, field agents equipped with mobile execution platforms can require mandatory photo proof of display builds. This operational shift gives leadership accountability and clean, validated data to accurately model promotional effectiveness and ROI.
KPI #4: Void Detection
What it is: A void occurs when a fully authorized, widely distributed SKU is completely missing from the retail shelf. This is distinctly different from a temporary out-of-stock. When a product is out of stock, the shelf tag remains, maintaining a physical footprint for the item to be replenished. When a void happens, there is no tag, no designated space, and no footprint. As far as the local store is concerned, your product does not exist.
Why you need to track it: Voids are incredibly dangerous because they act as silent killers of revenue. If an item is temporarily out of stock, you lose sales for a few days until the next truck arrives. However, a void guarantees absolutely zero sales velocity for that specific item indefinitely. Because the local store system doesn’t even recognize the product’s placement on the floor, it will never be reordered. Left unchecked, voids completely undermine your brand’s overarching distribution agreements and shatter revenue projections for new product launches.
How to optimize it: The biggest challenge with void detection is that human error makes it nearly impossible to spot manually. When field reps conduct audits using paper forms or basic spreadsheets, they naturally only evaluate the items they can physically see on the shelf. They don’t know what they are missing.
To solve this, modern field teams must utilize digital survey tools with mandatory checklist routing. Instead of a rep walking the aisle and logging what they find, the software dynamically generates a store-specific checklist of every single authorized SKU. The rep is forced to confirm the presence of each individual item, instantly catching any SKUs that have quietly fallen off the retailer’s radar. This proactive approach turns invisible distribution gaps into immediate, actionable fixes.
KPI #5: Pricing Compliance
What it is: Pricing Compliance is the crucial process of verifying that the physical shelf tag at the local store level accurately matches your brand’s everyday retail price (EDLP) or your specifically negotiated promotional price.
Why you need to track it: CPG pricing strategies are carefully engineered to balance profit margins with consumer demand. When pricing is mapped incorrectly at the shelf level, it completely ruins the “math” behind your strategy.
Consider the two most common pricing execution errors:
- The Unapplied Discount: If your brand funds a deep promotional discount to drive trial and volume, but the local store fails to update the shelf tag to reflect that sale, the shopper never sees the deal. Your expected volume lift will flatline, and the promotional budget is essentially wasted.
- The Accidental Markup: Conversely, if a retailer erroneously prices your everyday item significantly higher than agreed upon, it creates instant sticker shock. Overpriced items will suppress your sales velocity, directly driving your loyal customers toward more affordably priced competitors.
How to optimize it: Resolving pricing errors requires undeniable proof and incredibly fast, accurate communication. You cannot fix a bad price tag via email three days after the fact. By empowering your field teams with mobile retail execution apps, reps can instantly log pricing discrepancies the moment they spot them. They can capture photographic evidence of the incorrect tag and initiate immediate corrective workflows directly with the store manager, ensuring the price is fixed before the rep even leaves the building.
Capturing Data from the Field
Shifting your organizational focus from lagging sales data to leading indicators provides a true 360-degree view of your retail execution.
Modern CPG brands require real-time visibility and automated workflows that drastically reduce administrative time, allowing reps to spend more of their valuable time actually selling and building relationships.
FORM’s mobile retail execution platform and AI-powered Image Recognition empower your reps to instantly track On-Shelf Availability, verify Promotional Compliance, and catch voids in real-time—all while cutting admin time. Stop managing the past and start executing for the future by booking a demo today.
Frequently Asked Questions
What are CPG KPIs?
Consumer Packaged Goods (CPG) Key Performance Indicators (KPIs) are measurable values that brands use to track business performance. While traditional CPG KPIs focus on financial and supply chain data (like Gross Margin or Inventory Turnover), modern brands also track retail execution KPIs (like On-Shelf Availability and Promotional Compliance) to measure how well their products are performing physically inside the store.
What is the difference between lagging and leading CPG KPIs?
Lagging KPIs (such as Net Sales, Trade Spend ROI, and Customer Acquisition Cost) look backward—they tell you what happened after the quarter is over. Leading KPIs (such as Share of Shelf, Pricing Compliance, and Void Detection) look forward. They track real-time conditions at the shelf level, allowing field teams to correct issues before they cause a loss in sales.
Why is On-Shelf Availability (OSA) the most critical metric for CPG brands?
On-Shelf Availability measures whether a product is physically on the shelf and ready for a consumer to buy. It is critical because an out-of-stock item doesn’t just mean a lost sale today; it actively pushes your loyal customers to try a competitor’s product, potentially costing you their lifetime value.
How do CPG companies accurately track shelf-level KPIs?
Historically, CPG field reps tracked shelf metrics using paper forms or manual spreadsheets, which were slow and prone to human error (“pencil whipping”). Today, top CPG brands use mobile retail execution software and AI-powered Image Recognition. Reps simply take a photo of the shelf, and the software instantly calculates Share of Shelf, identifies voids, and verifies promotional displays in real-time.
What are the standard financial KPIs every CPG should know?
While leading execution metrics drive daily operations, CPG leadership still must monitor core financial benchmarks. The most common include Gross Margin (profitability after production costs), Cost of Goods Sold (COGS) (direct costs of producing goods), and Trade Spend ROI (the financial return generated from retailer promotional investments).