A decade-long look at U.S. average retail prices for 10 common supermarket items reveals exactly where your grocery budget is going today.
Most of us run through the grocery store on autopilot. You grab the same brand of coffee, the same loaf of bread, and the same cut of meat week after week. But if you’ve felt a jolt of anxiety when the cashier hands you the final receipt lately, the data shows your instincts are completely accurate.
While week-to-week price fluctuations are normal, zooming out to a ten-year timeline reveals the true trajectory of everyday expenses. By comparing a standardized, 10-item basket of household essentials from March 2016 to March 2026, we can strip away the noise and see the real-world difference at the register. The contents of the shopping cart haven’t changed, but when you look at the results of the FORM team’s research, the financial toll tells a dramatically different story.

Share this infographic by embedding this code:
Where grocery inflation hit hardest
The largest increases were concentrated in a handful of staple categories, particularly coffee, meat, and pantry goods.
Ground coffee more than doubled in price over the decade, rising from $4.41 per pound in 2016 to $9.61 in 2026. That 117.91% increase made coffee the single largest outlier in the basket.
Ground beef also posted a steep climb, increasing from $3.96 to $6.70 per pound. Meanwhile, long-grain white rice, often considered one of the more affordable grocery staples, rose nearly 50%, climbing from $0.71 to $1.06 per pound.
Because these products are purchased regularly in many households, increases in these categories can have an outsized impact on weekly grocery spending.
How staple grocery prices changed over 10 years
| Item | 2016 Price | 2026 Price | % Change |
|---|---|---|---|
| Eggs (Grade A large, 1 dozen) | $2.08 | $2.35 | +12.98% |
| Milk (whole, 1 gallon) | $3.19 | $4.07 | +27.59% |
| Bread (white, 1-pound loaf) | $1.42 | $1.81 | +27.46% |
| Chicken (boneless breast, 1 pound) | $3.27 | $4.17 | +27.52% |
| Potatoes (white, 1 pound) | $0.65 | $0.85 | +30.77% |
| Bananas (1 pound) | $0.59 | $0.66 | +11.86% |
| Rice (long-grain white, 1 pound) | $0.71 | $1.06 | +49.30% |
| Cheddar cheese (1 pound) | $5.36 | $5.97 | +11.38% |
| Ground beef (1 pound) | $3.96 | $6.70 | +69.19% |
| Coffee (ground, 1 pound) | $4.41 | $9.61 | +117.91% |
Prices shown are March averages (U.S. city average) from the BLS retail price series.
The steady rise of everyday staples
Not every grocery item experienced dramatic spikes, but many common staples posted consistent increases in the 25% to 30% range.
Milk rose from $3.19 to $4.07 per gallon, while white bread increased from $1.42 to $1.81 per loaf. Boneless chicken breast followed a similar trajectory, climbing 27.52% over the decade. White potatoes slightly exceeded that range, increasing 30.77%.
Individually, these increases may appear manageable. Collectively, however, they contribute significantly to the overall rise in grocery costs because they represent products consumers buy frequently and in large quantities.
The most stable items in the basket
A few staples remained comparatively stable over the decade.
Bananas recorded the smallest increase in the basket, rising from $0.59 to $0.66 per pound. Cheddar cheese and Grade A large eggs also posted relatively modest increases compared with the rest of the data set.
That long-term stability is especially notable in the case of eggs, which experienced several short-term price spikes during the decade due to supply disruptions and inflationary pressures. Despite those fluctuations, their overall 10-year increase remained lower than many other staples.
A decade of higher grocery costs
The uneven nature of these increases highlights an important reality of grocery inflation: Consumers do not experience rising prices equally across every category.
Households that spend more on products like coffee, beef, or rice likely felt a sharper increase in grocery expenses than the overall basket average suggests. Meanwhile, staples with smaller increases helped moderate the final total.
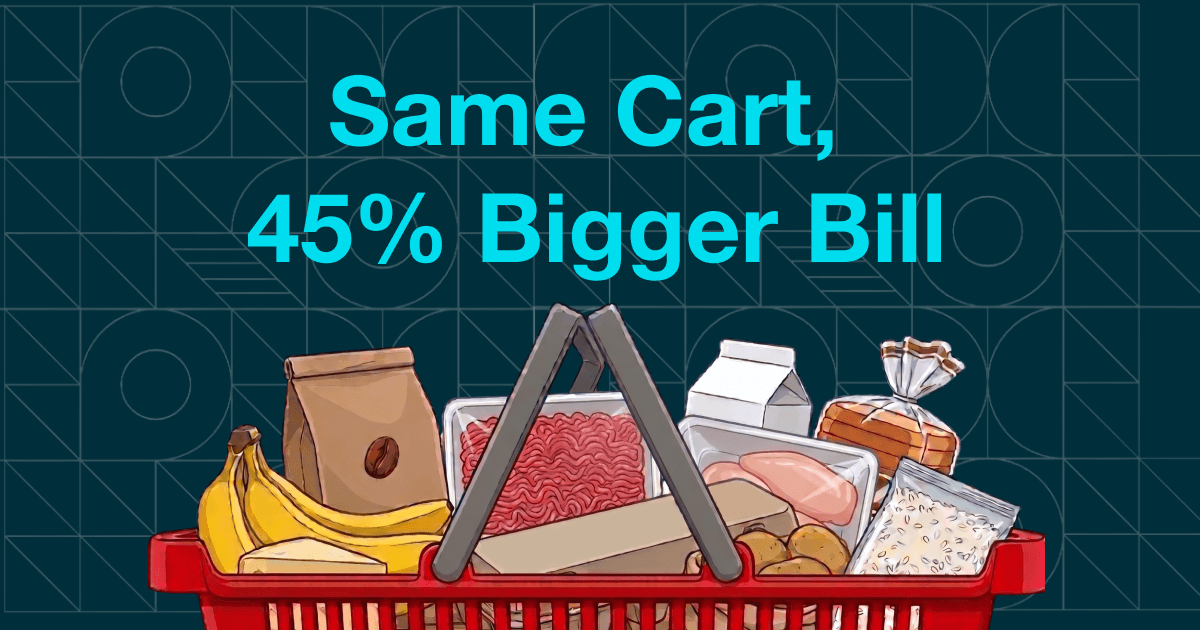
Still, the broader trend in price-tracking data is clear. A grocery basket that cost just more than $25 in 2016 now costs more than $37 in 2026, illustrating how even routine purchases have become substantially more expensive over time.
As costs continue to rise across industries, maintaining clear, consistent visibility into pricing data becomes increasingly important for grocery store operations. At FORM, we help teams capture that data in a structured way so they can better understand what’s happening on the ground and respond with confidence.
Frequently asked questions
Why did grocery prices rise so much during the 2020s?
Several factors contributed to rising grocery costs during the decade, including inflation, supply chain disruptions, labor shortages, transportation costs, climate-related agricultural pressures, and shifts in global commodity markets.
Which grocery item increased the most between 2016 and 2026?
Ground coffee recorded the largest price increase in this comparison, rising 117.91% over the decade. The average price climbed from $4.41 per pound in 2016 to $9.61 in 2026.
Why did coffee prices increase faster than many other groceries?
Coffee prices were affected by poor harvests in major coffee-producing regions, rising shipping costs, and strong global demand. Because coffee is largely imported into the U.S., international supply disruptions can significantly affect retail prices.
Why were egg prices so volatile during the 2020s?
Egg prices experienced temporary spikes during the decade due to avian influenza outbreaks, supply shortages, and higher feed and transportation costs. Despite those fluctuations, eggs still posted one of the smaller long-term increases.
Are grocery prices expected to keep rising?
While some categories may stabilize, food prices have historically trended upward over long periods. Future grocery prices depend on factors such as inflation trends, fuel costs, agricultural output, labor markets, and global trade conditions, all of which tend to push prices higher over time.
Sources:
- https://fred.stlouisfed.org/series/APU0000708111
- https://fred.stlouisfed.org/series/APU0000709112
- https://fred.stlouisfed.org/series/APU0000702111
- https://fred.stlouisfed.org/series/APU0000FF1101
- https://fred.stlouisfed.org/series/APU0000712112
- https://fred.stlouisfed.org/series/APU0000711211
- https://fred.stlouisfed.org/series/APU0000701312
- https://fred.stlouisfed.org/series/APU0000710212
- https://fred.stlouisfed.org/series/APU0000703112
- https://fred.stlouisfed.org/series/APU000071731