In the post-lockdown world, keeping up with health and safety guidelines is paramount. New regulations, best practices, and local rules continue to trickle down to customer-facing businesses every day. It’s a lot to keep up with, especially considering that consumer confidence is trending poorly.
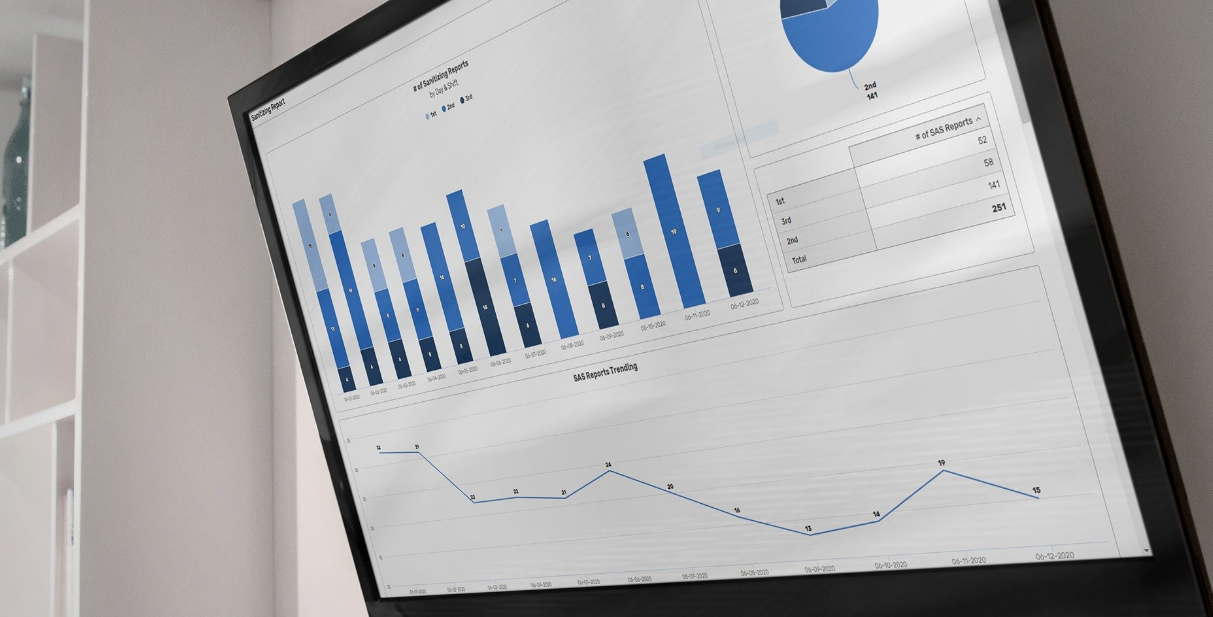
There’s an elegant solution to ensuring both internal compliance and consumer transparency: dashboards. Dashboards powered by digital forms can dramatically improve the effectiveness of a new health and safety strategy. Using tablets featuring mobile forms, workers can keep track of sanitization practices, show their compliance, and log incidents. This information is then visualized on a screen that shows how the establishment is trending for the day. Real-time performance metrics are displayed like a speedometer, providing instant feedback on your business’s COVID-19 prevention practices.
Dashboards can display all kinds of relevant data, such as:
- The last time an employee washed her hands
- The percentage of employees that have used sanitization stations
- Sanitization compliance over extended periods of time
- The last time the bathrooms were sanitized
- Visualizations of health and safety data, like pie charts and graphs
Once employees are trained in your new sanitization practices and are consistently beating their “high score” on the dashboard, it’s time to consider showing this information to your customers. Displaying health and safety performance data in real time on a customer-facing dashboard has the potential to boost customer confidence.
For example, consider what health and safety assurances you would like to see when you enter a new eatery as a customer. A passing health inspection is always good to see, but that only tells you about the store’s performance on one day in the past. What about today? With up-to-the-minute sanitization data, you can rest assured that the restaurant’s back-of-house staff is keeping up with the best practices.
Likewise, many businesses with a lot of customer interaction don’t even have a “health inspection” equivalent. Customers are left to speculate—do employees follow social distancing guidelines? Do they wash and sanitize their hands regularly? Taking the extra step in showing your compliance (even though it’s not required) can inspire much more confidence.
Form.com is now offering a solution for displaying up-to-the-minute sanitization data to your customers. It’s easy to set up, cost-efficient, and highly configurable. Even if your organization follows very specific sanitization rules, you can easily shape your Form.com solution to meet your unique requirements. If you’d like to learn more about how a dashboard can ensure compliance and inspire confidence in your customers, request access now.